Getting Started with Logic Analyzers and Pulseview
Hey all,
Been a while. Hope you’ve been up to no good, hm?
A couple of days ago, I had to do some low-level I2C work on a bare-metal ATMega328P. Digging out the datasheet, I cobbled a simple I2C driver together, the purpose of which was to permit me write a driver for the particular peripheral which would call the lower-level functions the driver provided (i.e things like i2c_start(), i2c_stop(), i2c_address(), etc etc). When I finished the I2C driver, I tested it out with an MMA8452Q I had lying about and it seemed to work just fine. Believing everything to be dandy, I went ahead and wrote the peripheral driver for the component I was working with. And that was when the funny stuff started.
To cut that long story short, it wouldn’t work right when deployed to the hardware. At all. I was in a bit of a bind – the code looked great, no errors no nothing, so it was time to look at the hardware/wire-level end of things.
Logic analyzers (in my limited understanding) are tools/instruments that are used to give a deeper insight at a wire/electrical/hardware-level in a given system. More importantly, when coupled with suitable software, they can provide traces (or graphs) showing the logic states of one or more signals. They differ from oscilloscopes in that they are purely digital, so they’ll only display a high or a low for any given signal. Something like this would have applications in displaying and measuring things like period and frequency (at the very minimum) so it can be used as a ‘scope for digital systems. But that’s not the truly interesting bit.
Logic analyzers (as the analysis part implies) are also capable of decoding digital protocols, such as SPI or I2C or even trusty old asynchronous serial (UART comms). That is, feed them a signal (or set of signals) speaking some digital protocol and they will be able to tell you what the signals are trying to say. Case in point, UART comms on an electrical level are defined by one start bit, a variable number of data and parity bits, and one or two stop bits. Looking at say, the TX line of an actively-transmitting peripheral on a ‘scope would display plenty high-low-high transitions, which probably wouldn’t be very insightful. Most (if not all) logic analyzers will have the capability to decode the UART comms signals and display the actual ASCII characters being transmitted. We’ll look at live examples of this in a bit.
One of the major strengths of a logic analyzer lies in the abilities of its companion PC software. It would seem that the ability to decode signals lies in this companion software not the hardware (which seems to be purely concerned with acquiring signals as fast and as accurately as possible). Mid to high range LAs like Saleae’s offerings or Digilent’s Analog Discovery are equipped with some really impressive software. However, I do not own any of these – there’s a myriad of cheap (~$10) versions that work with Sigrok and PulseView, so I’ll concentrate on that, but the concepts remain largely similar. In any case, I own one of these cheap versions myself – an 8-channel, 24MHz Saleae Logic clone from AliExpress.
Sigrok is a cross-platform, open-source project targeted towards building an open-source signal analysis suite for instrumentation devices – multimeters, oscilloscopes, Logic Analyzers, etc. As such, it is under active development and still doesn’t support everything, but it has wide range support for different types of hardware. Primarily it provides a command line program, (not surprisingly) called sigrok-cli which permits interaction with supported devices. However I tend to prefer GUIs where available, and that’s where PulseView comes in. PulseView is a graphical interface for sigrok-cli, so you get bells, whistles, dropdowns and draggable windows..
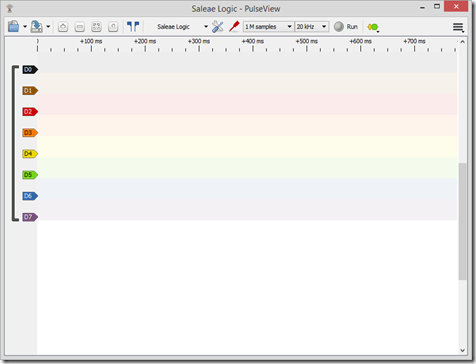
Hooking up the analyzer itself is largely straightforward – plug it into any available USB port. It doesn’t need a driver per se – although in some cases you may need to use the LibUSB Zadig tool to install a LibUSB driver for the device. Something like shown here. Once that’s done, download and install PulseView from here (be sure to download a binary/distribution package) and fire it up. It should automatically pick up the logic analyzer hardware (on Windows the device disconnect and device connect sounds play in succession). You’ll end up with a screen that looks something like this:
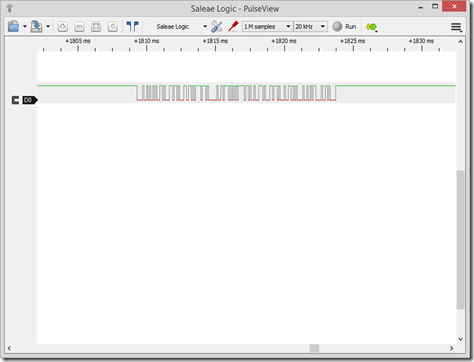
So let’s hook it up to a microcontroller UART transmitting a secret message…always remember to connect the analyzer’s ground pin to the circuit’s own ground or you’ll have some real unusual behavior. You can pick any terminal/channel to use. Here I’m using Channel 0 as seen below. To capture the signal, click the Run button on the right half of the toolbar. You can click “Stop” once you’ve gotten something, and zoom in/pan (mouse wheel, middle click and drag respectively) to get something like this:
Let’s remove unused channels. This is done by clicking on the little red probe button to the left of the dropdown reading “1M samples” and unchecking the boxes corresponding to any unwanted channels. I want only Channel D0 so I’ve unchecked the boxes for Channels D1 through D7. Here’s what I got:
That’s a better picture. Not very informative still, as all we can see are ups and downs, so let’s add a UART protocol decoder in there and see what we get. This is done by clicking on the yellow-and-green icon to the right of the “Run” button. This produces a dropdown showing us the available protocol decoders:
As seen, there’s even a protocol decoder for USB! So, we select the “UART” protocol decoder. It appears on the left as the red tab marked “UART” in the figure:
(Quick Tip: To remove an unwanted protocol decoder, simply right-click on the corresponding protocol decoder tab and select “Delete”)
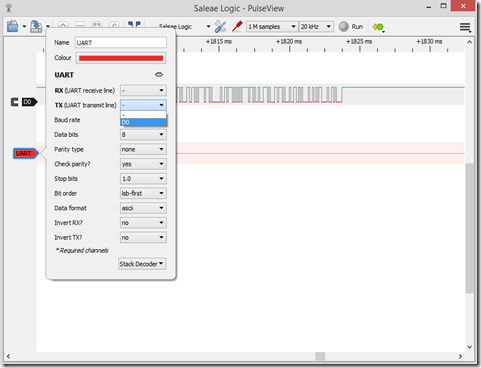
Now we have to configure it. This basically involves specifying which Logic Analyzer channel maps to which protocol decoder signal input. This is particularly important for protocols like SPI or I2C.Here’s a screenshot of said configuration process:
(Quick Tip: You can give a channel a friendly name by double-clicking on the corresponding tab to the left of the screen and typing the name in the little dialog that appears. Some protocol decoders even auto-map channels if they’re appropriately named e.g naming a channel SDA and adding an I2C protocol decoder will automap that channel to the SDA input of the protocol decoder)
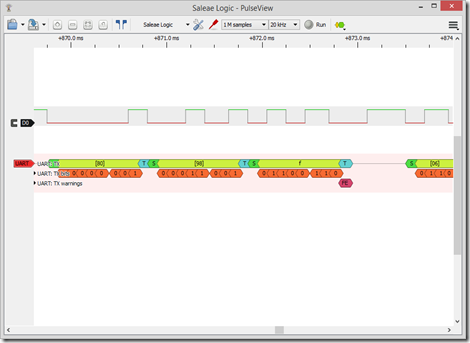
Once we select the appropriate channel (D0 is the only available option since I’ve disabled all the other channels) and baud rate (I’m transmitting at 4800 so select that) the protocol decoder runs and we obtain something like this:
That’s right – the protocol decoder processed the samples we’d already captured and produced those results, so now we know the mystery message. Now, we can capture some more of the “mystery message” by clicking on the “Run” button on the top of the screen. We can stop it after a while or let it run out on its own. As the capturing process runs, the protocol decoder also runs, analyzing and processing the hardware-level protocol although not quite in real-time. If you’re running this live you’ll notice that the protocol analyzer bit seems to be moving from the start of the captured samples to the end. That’s it doing the processing bit. As it processes, it leaves results in its wake.
There a few things of note here. One is the sample rate, specified by the dropdown to the left of the “Run” button. The higher the sample rate, the more samples are captured per unit time (duh) but more importantly, the greater the maximum frequency of signals under consideration. For example, for an I2C clock frequency of 100KHz, the Nyquist theorem says the minimum sampling frequency of this clock signal should be 2 * (maximum signal frequency) = 2 * 100KHz = 200KHz. This is important because if you sample a signal at less than the Nyquist frequency, aliasing will occur and the results you obtain likely won’t make sense. For high-speed protocols like USB, this is definitely something to worry about. As another case in point, in this example, we’ve sampled a 4800 baud stream at 20KHz. If the message was being transmitted at say, 9600 baud (remember to also re-configure the protocol analyzer’s baud rate), we’d have ended up with this:
Which is obviously not the secret message. Note also that the among the protocol decoder annotations (the colored bars at the bottom giving us the good stuff) there’s an additional one called “UART: TX Warnings”, and we can see “FE” along its output line. “FE” stands for framing error, which for the UART protocol usually means a timing/baud rate mismatch between transmitter and receiver. This is likely occurring since the protocol decoder is seeing aliased data which violates the UART timing standard, and thus indicates a Framing Error in the detected samples. In addition, Pulseview seems to store samples in memory, so you cannot capture a signal in perpetuity. Specifically, this means you can only capture finite amounts/durations of a signal. This is determined by the number of samples selected in the dropdown to the left of the sample rate dropdown. So if we select the number of samples to be say, 1M, at a sample rate of 200KHz, then that means that we get 200,000 samples per second, translating to about 5 seconds worth of signal capture time. In general, the duration captured is: (Num of samples) / (sample rate) . Thus, when using very high sample rates, be sure to select a correspondingly large number of samples so you can have meaningful data to work with. The higher your sample rate, the more stress your CPU undergoes and the larger the number of samples, the more memory is used (presumably) so keep these in mind.
Finally, sigrok has the ability to save signal captures to disk. This is useful for when you or someone else wants to share a recording of a signal capture. You can do this by capturing some signal, then clicking on the “Save” icon at the top left of the screen (second from the left on the toolbar) and selecting “Save As”. Give the capture session a name and be sure to save it as “Srzip session files (.sr)”. I’ve found that this works excellently as compared to some of the other formats I tried. As an exercise, PulseView ships with some sample .sr files, in <installdir>/Pulseview/examples. Open any of them using the “Open” icon on the toolbar (first from the left) and you should be rewarded with a graphical view of what is contained in the file, inevitably some signals. You can then run a protocol decoder on the signals (using the process described earlier) and see what you can find.
I hope you find this as useful as I do.
Ps: I forgot to mention that in addition to protocol decoders, sigrok/PulseView also gives you Stack Decoders, which are in effect higher level decoders for specific hardware peripherals. For example, nRF24L01+ radios communicate over SPI, so naturally when debugging them you’d want to capture the SPI signals and then load an SPI protocol decoder over the captured samples. However, sigrok/PulseView also gives you a stack decoder specifically for nRF24L01+ radios, which further processes the SPI transactions in the context of the nRF24 radios. The screenshots below show a sample nRF24L01+ capture (shipped in the PulseView examples directory) with an SPI protocol decoder only, then with a nRF24L01+ stack decoder added onto the SPI protocol decoder. Stack decoders are activated by opening the protocol decoder’s configuration dialog and clicking on the dropdown labelled “Stack decoder”, then selecting the particular hardware peripheral in use.
Looking at the annotations in the lower picture, there are three additional lines giving more nRF24-specific info about the SPI transactions – basically telling us that the first two bytes are the ACTIVATE command for the radio, and that the chip responds with the contents of its STATUS register. Similarly we see the same thing for the next two bytes and there’s even a warning in there. This can be a godsend since it means you don’t need to switch between PulseView and the datasheet window trying to make sense of individual bytes sent on the wire. At this time there aren’t that many Stack decoders, but sigrok is young yet…
PPS: Er, PulseView also has cursors – for measuring the duration of a particular signal and even reverse-calculating the frequency from the duration. The cursors are invoked by clicking on the icon with two blue thingies on it on the toolbar. Once visible, they can be dragged to highlight the signal duration of interest..
Enjoy!







Comments
Post a Comment